Company
Plume
Project
Data Stories
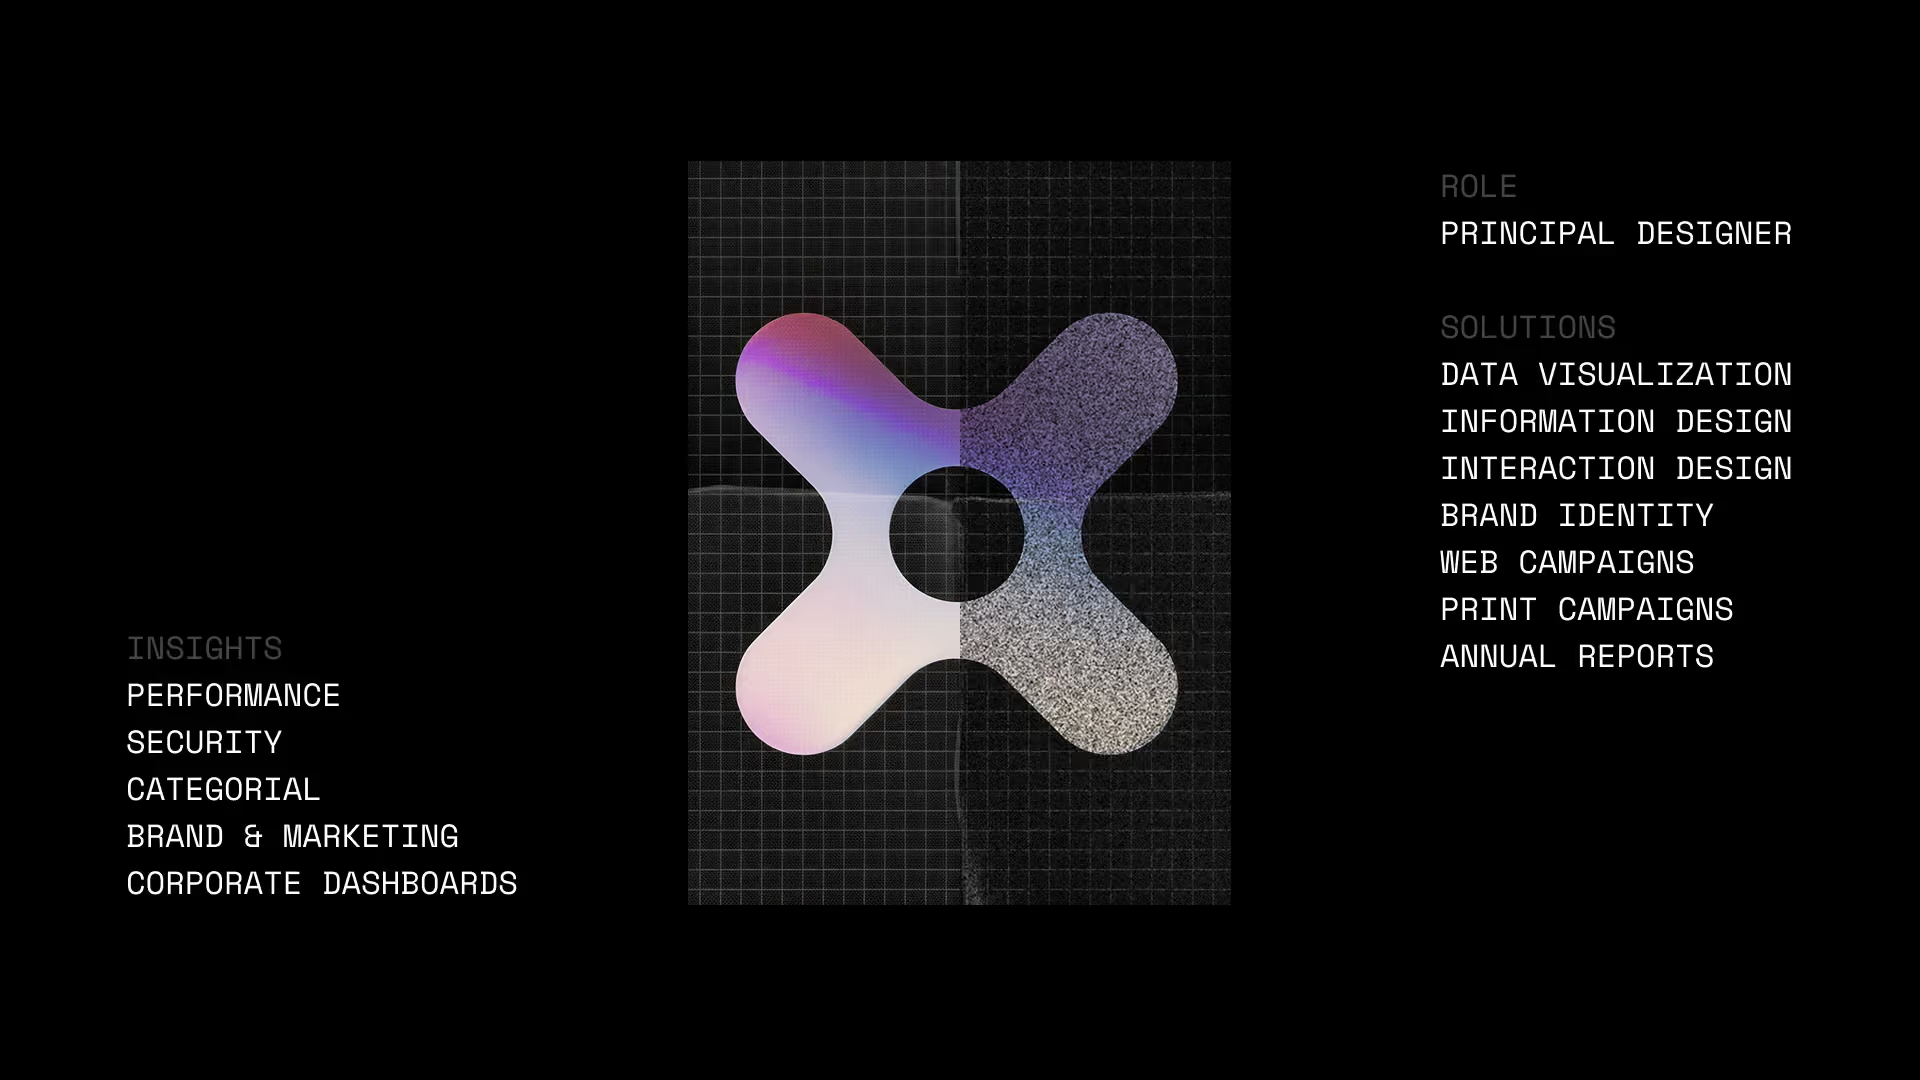
Role
Principal Designer
Scope
Data visualization
Information design
Interaction design
Brand identity
Built with
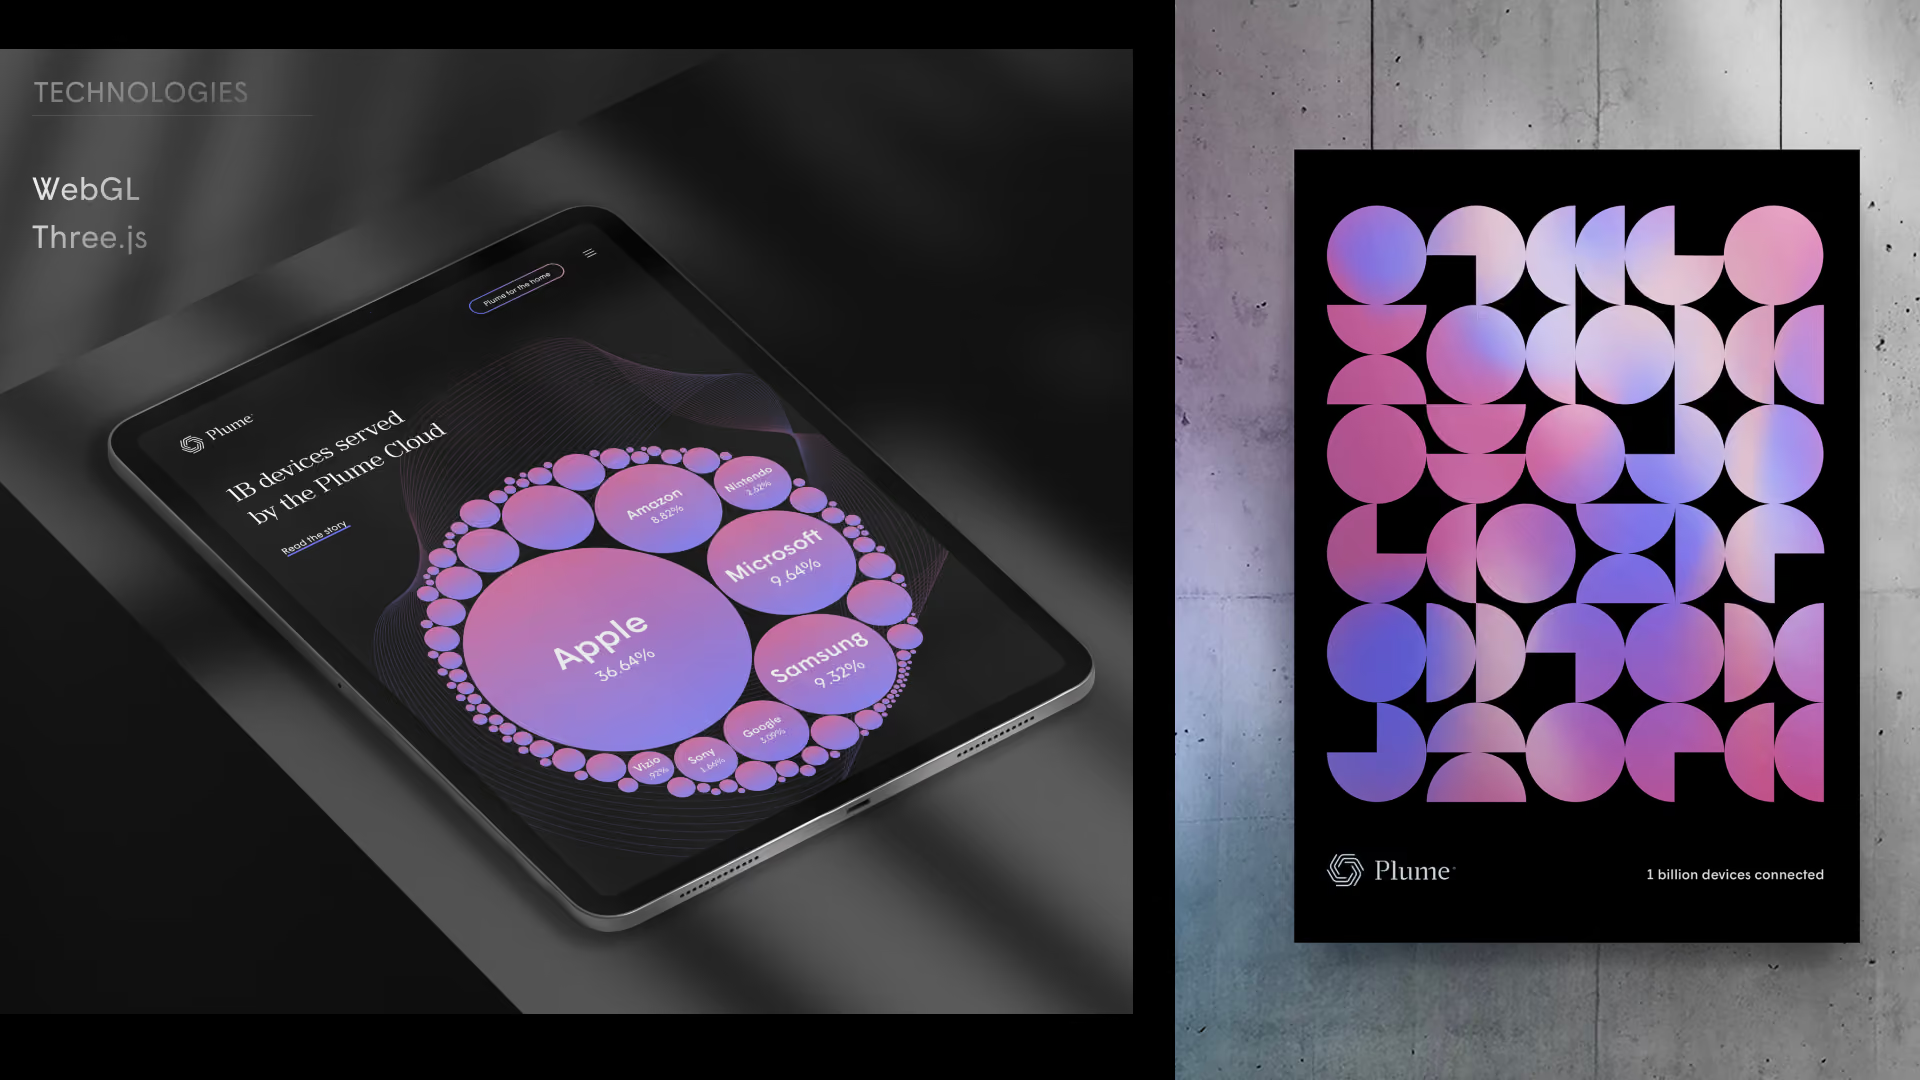
WebGL, Three.js
Year
2022
Overview
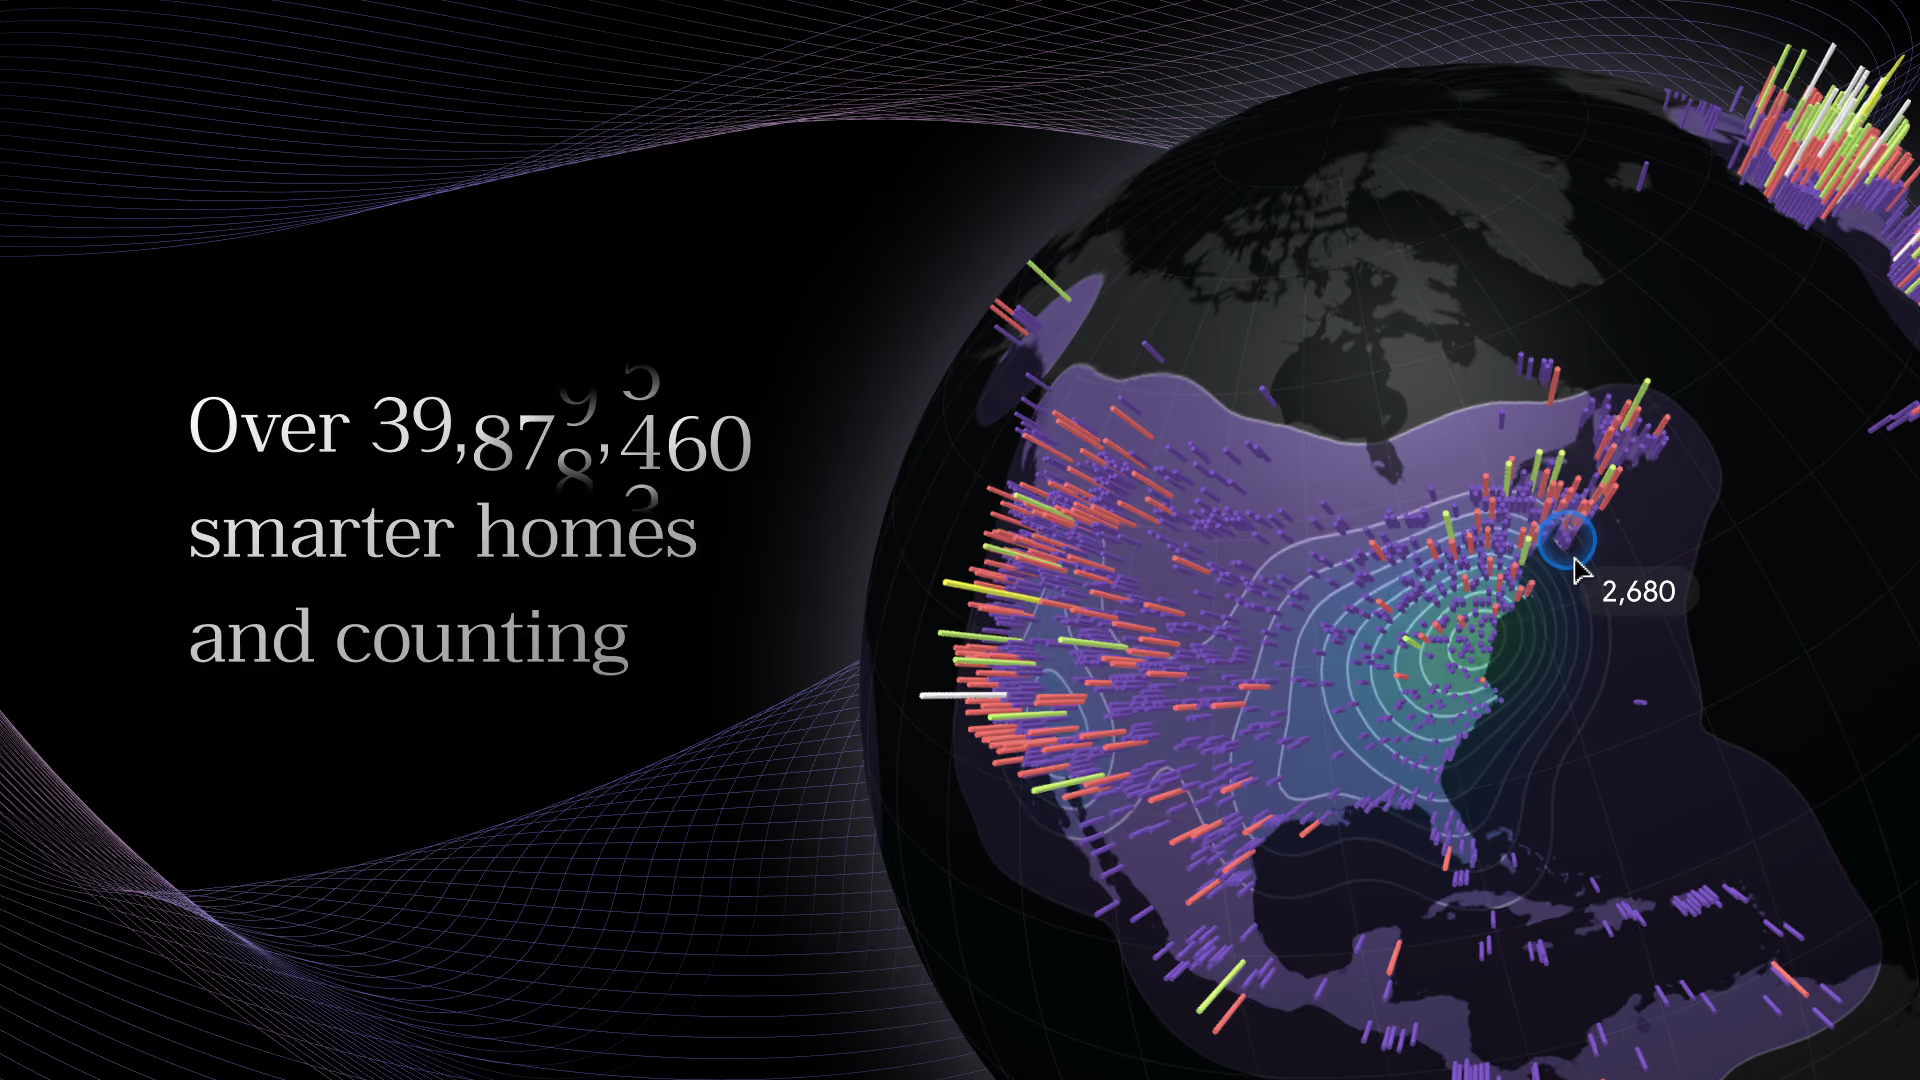
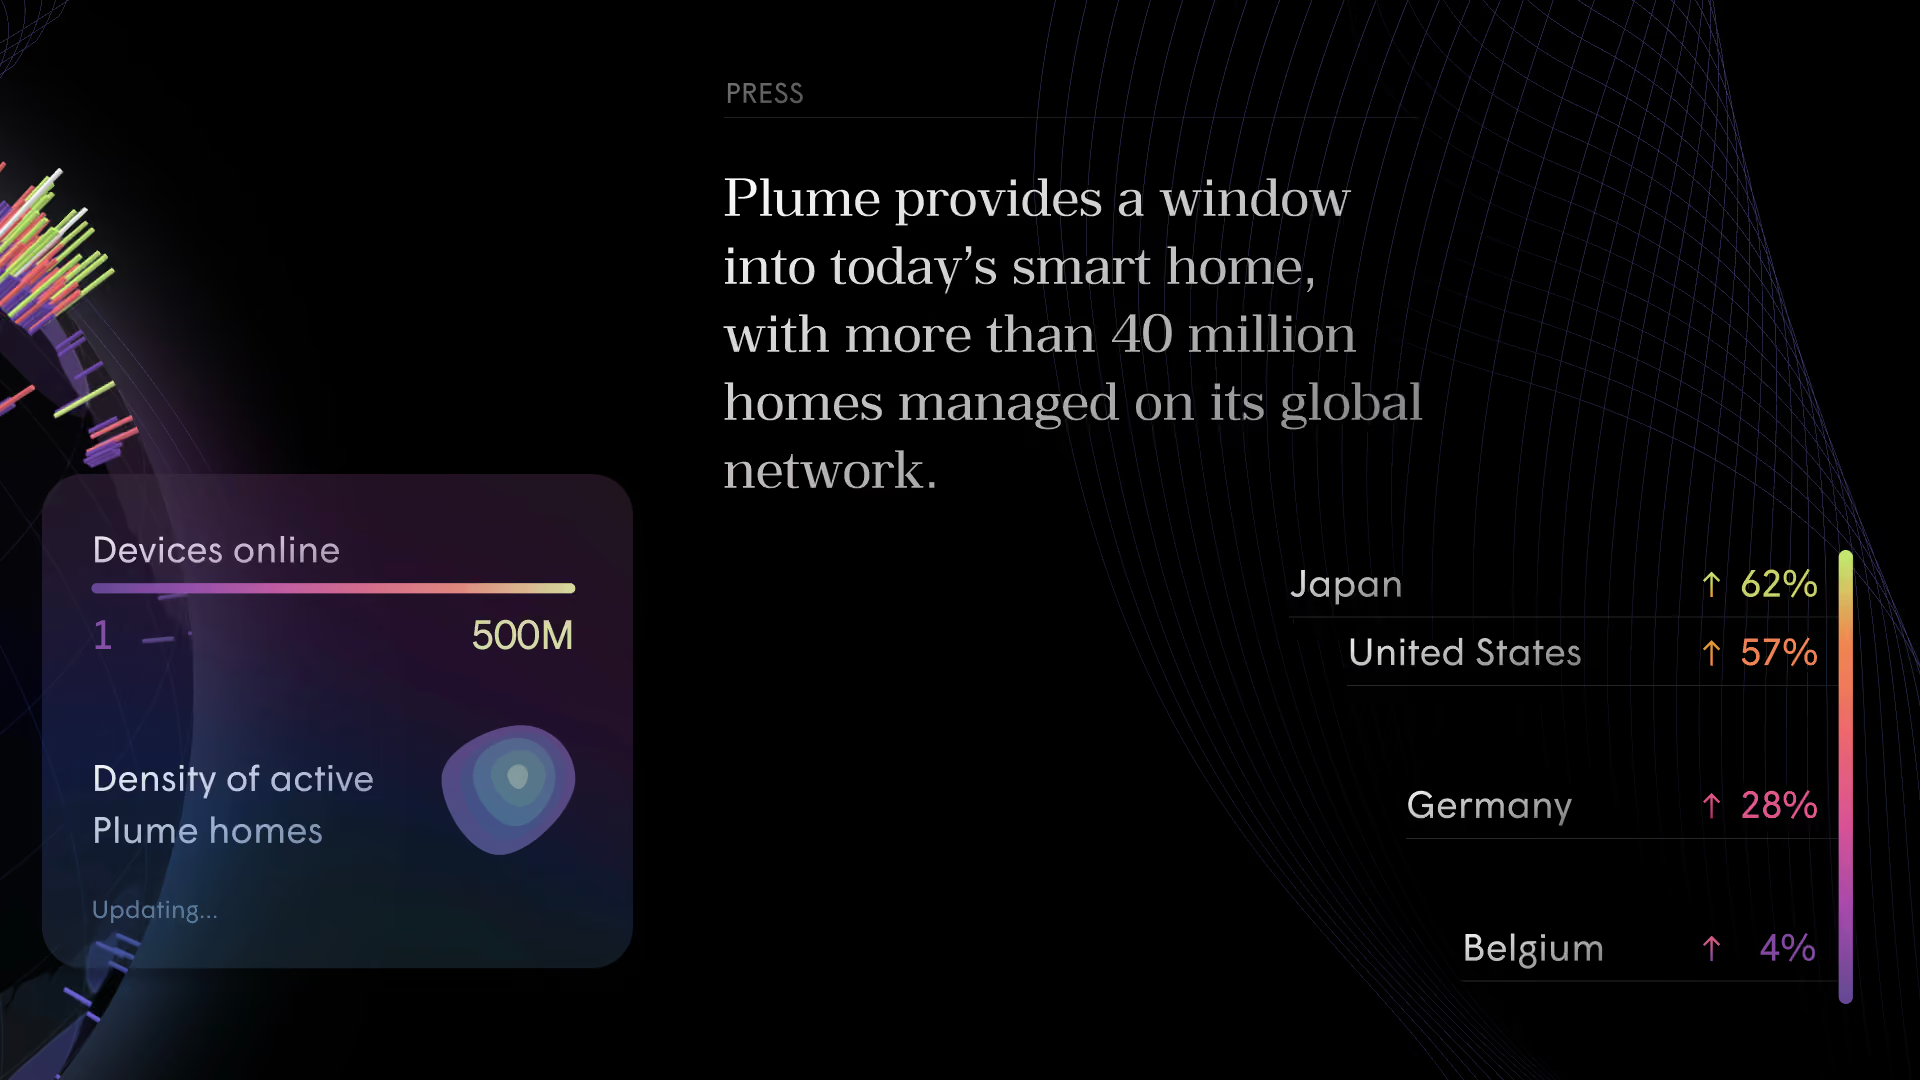
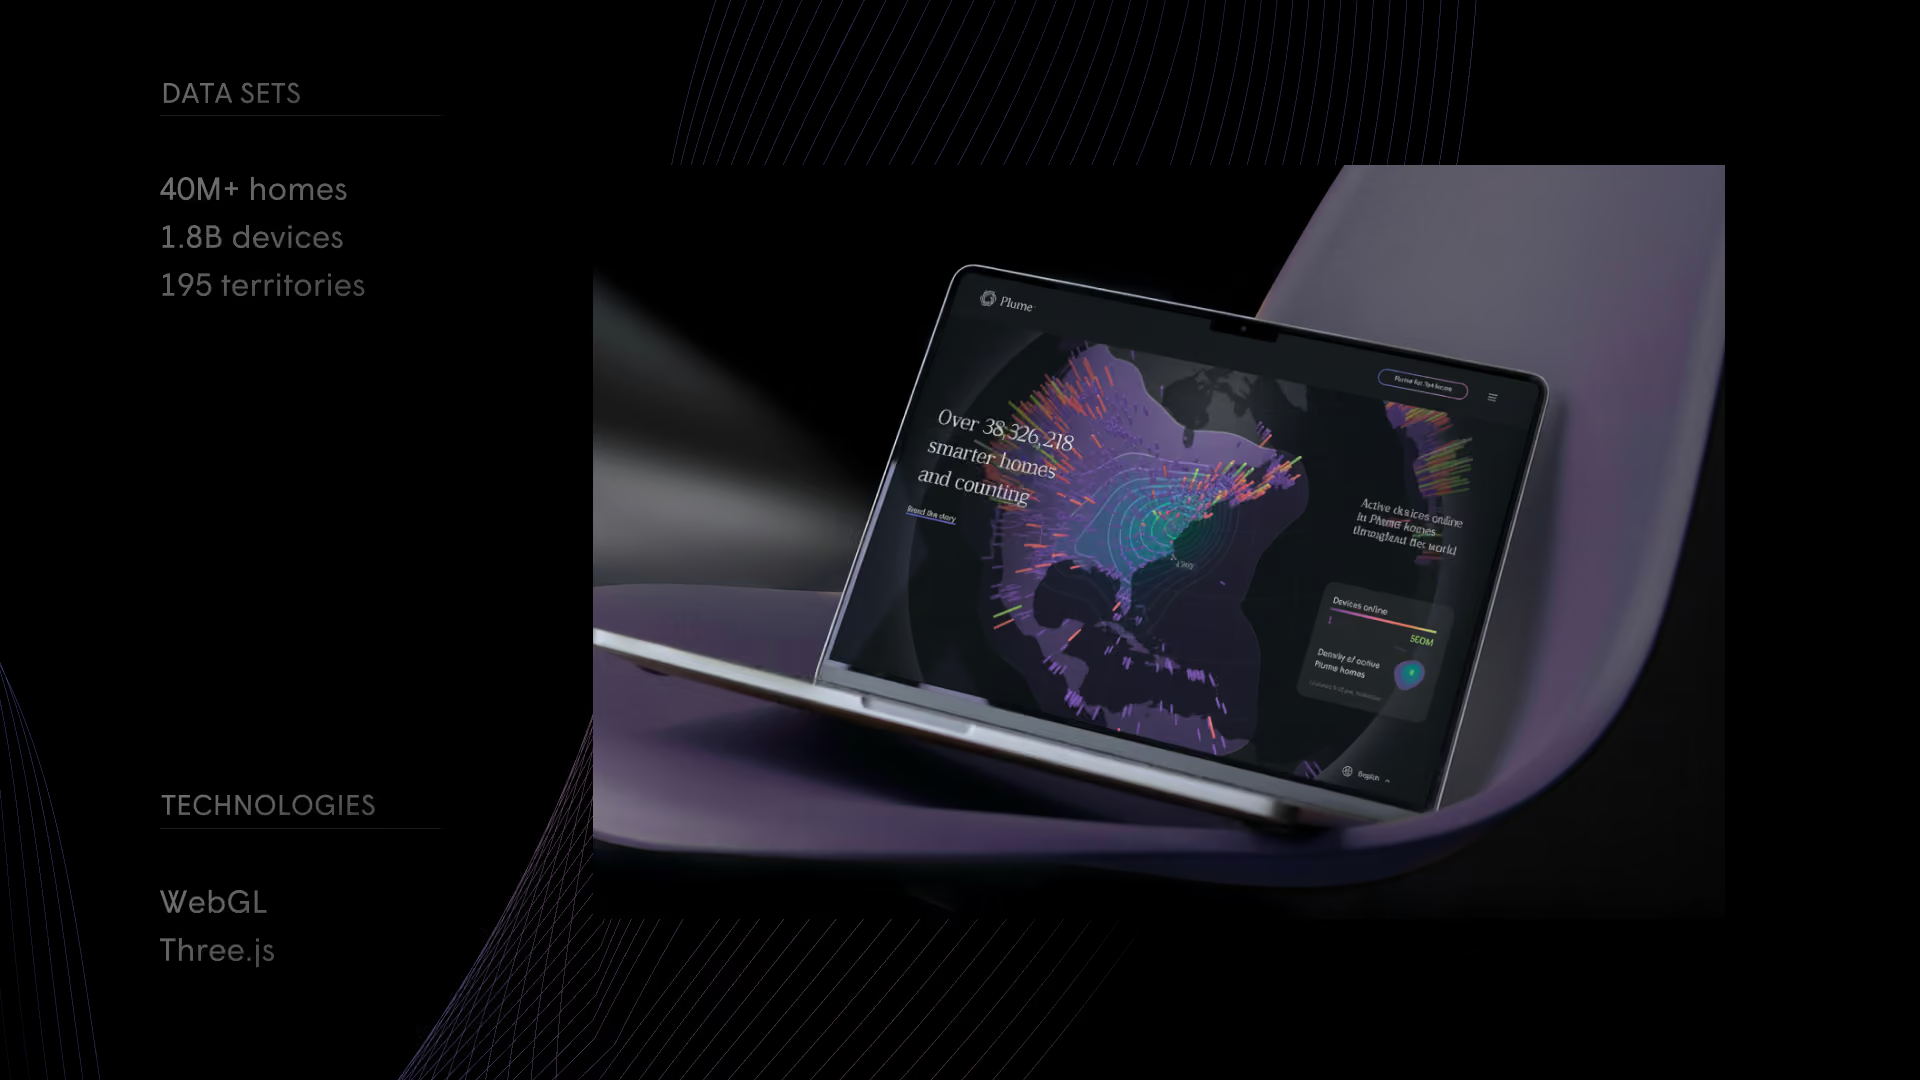
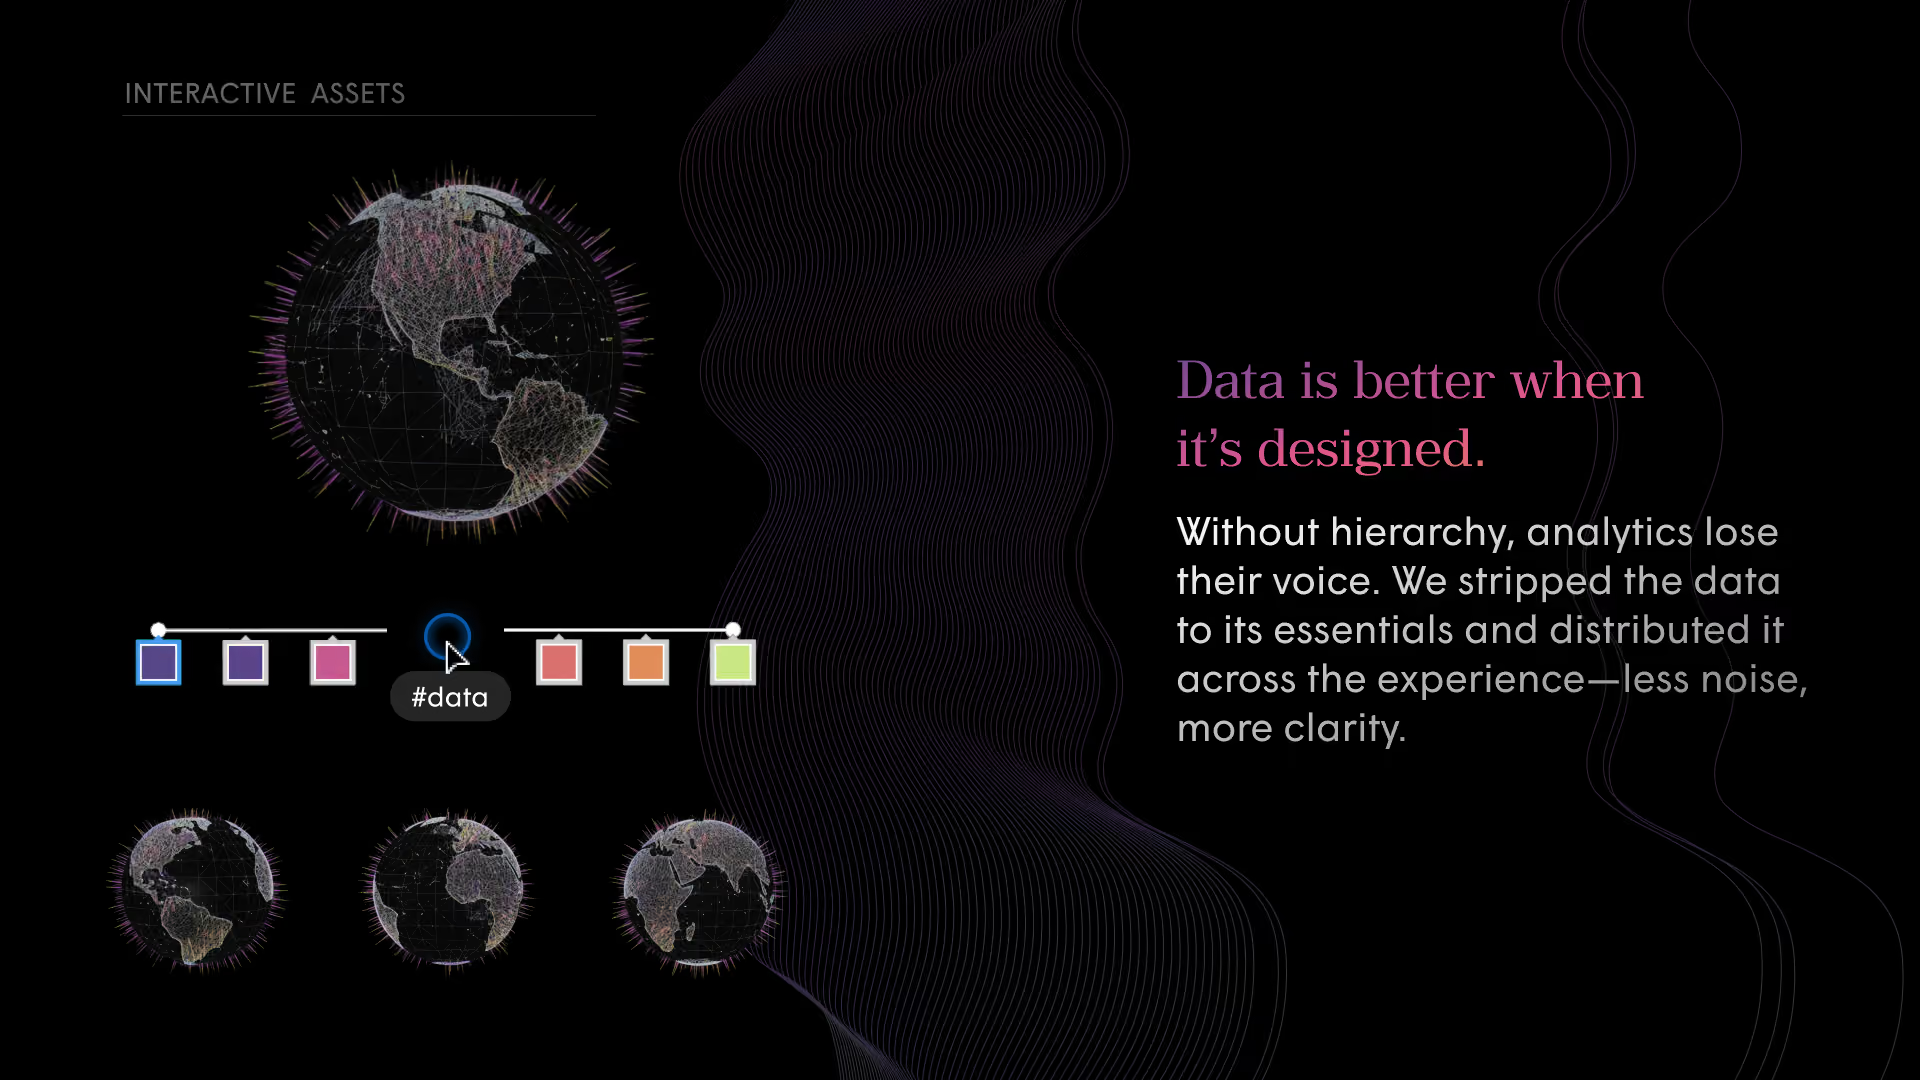
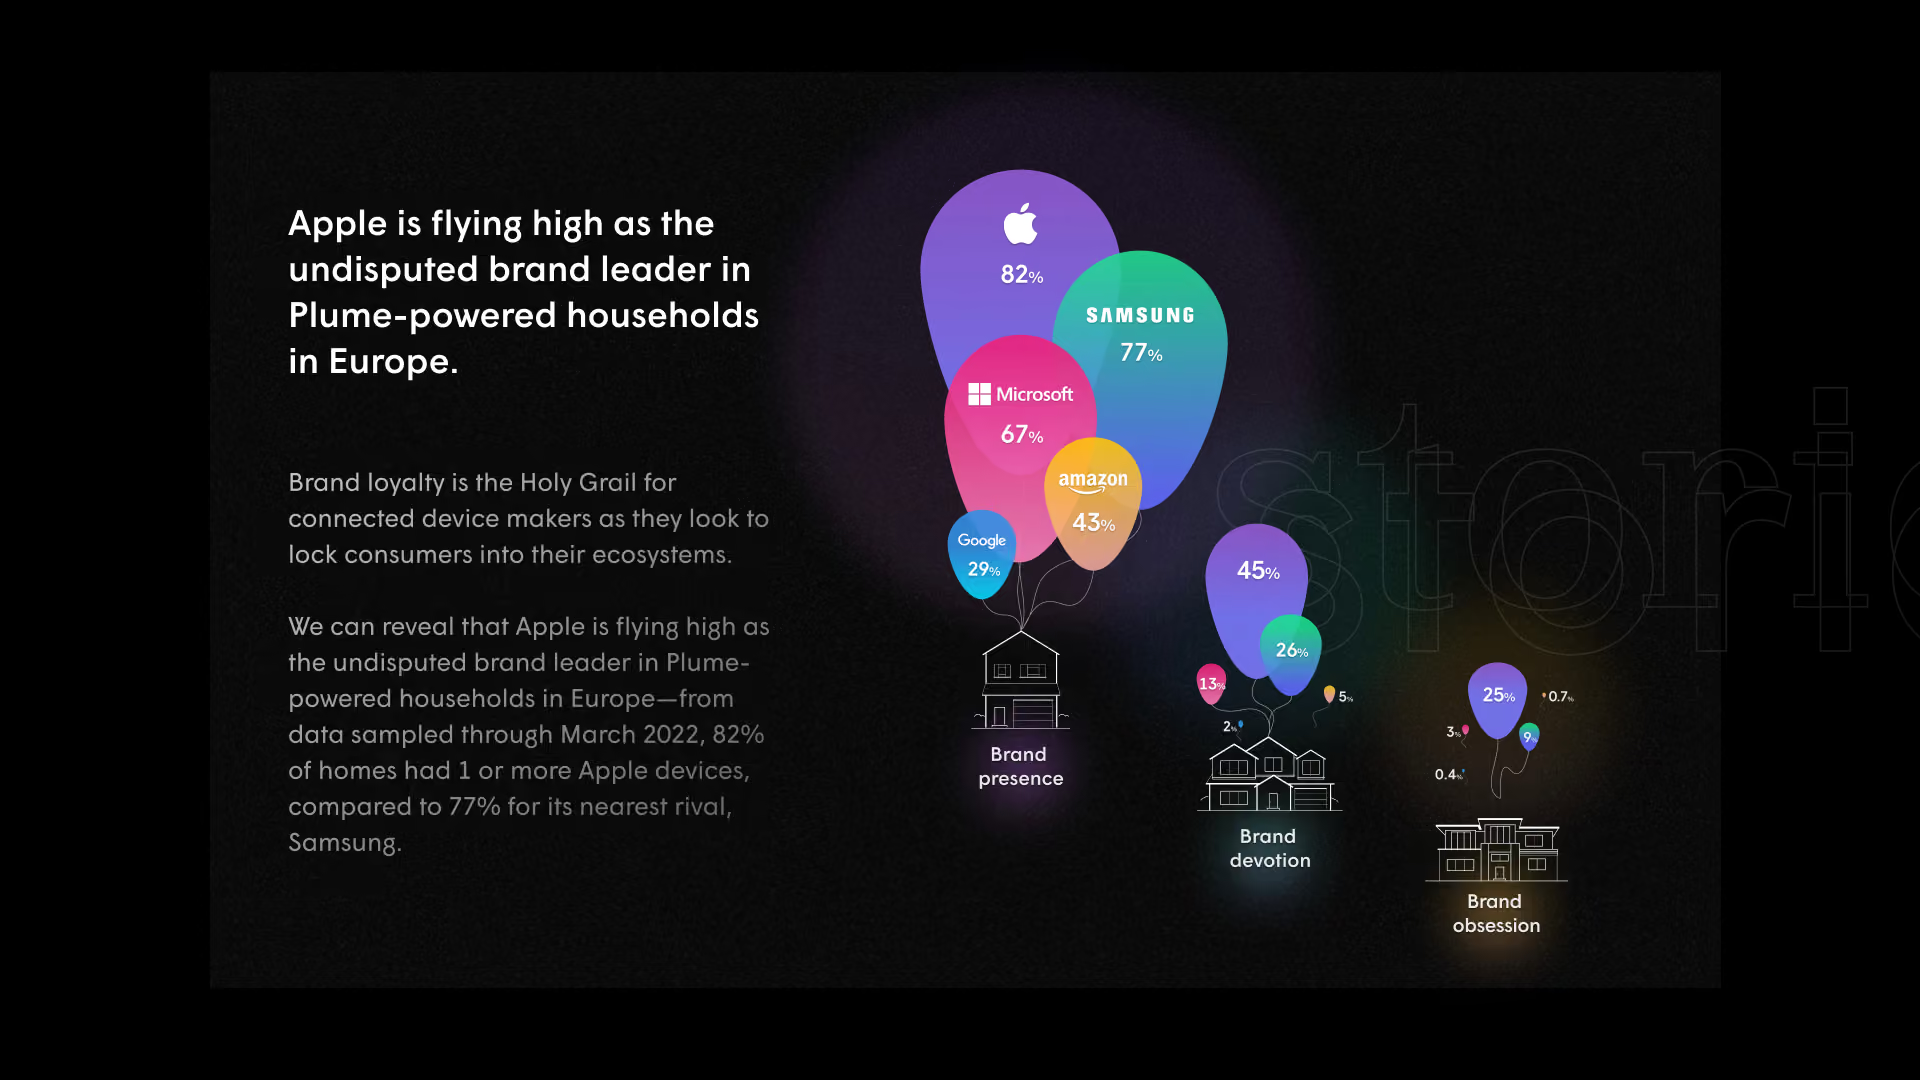
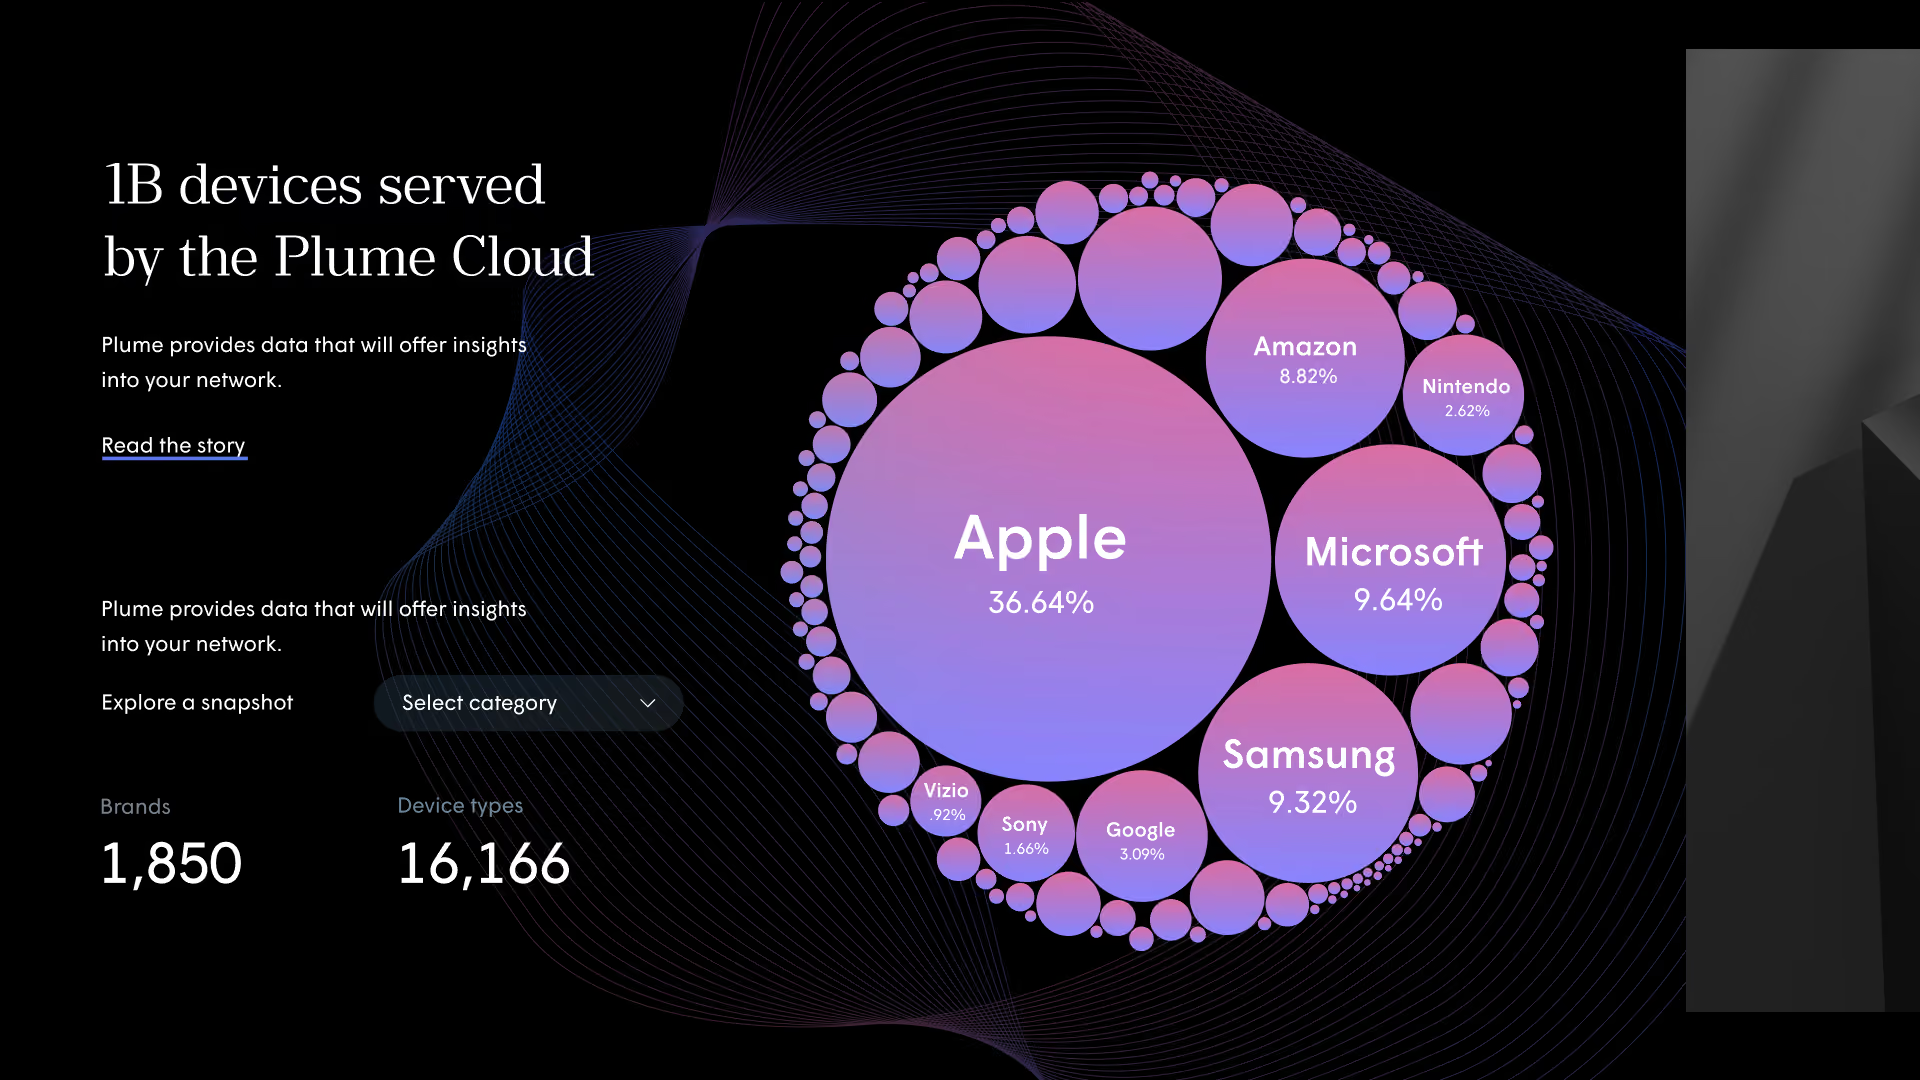
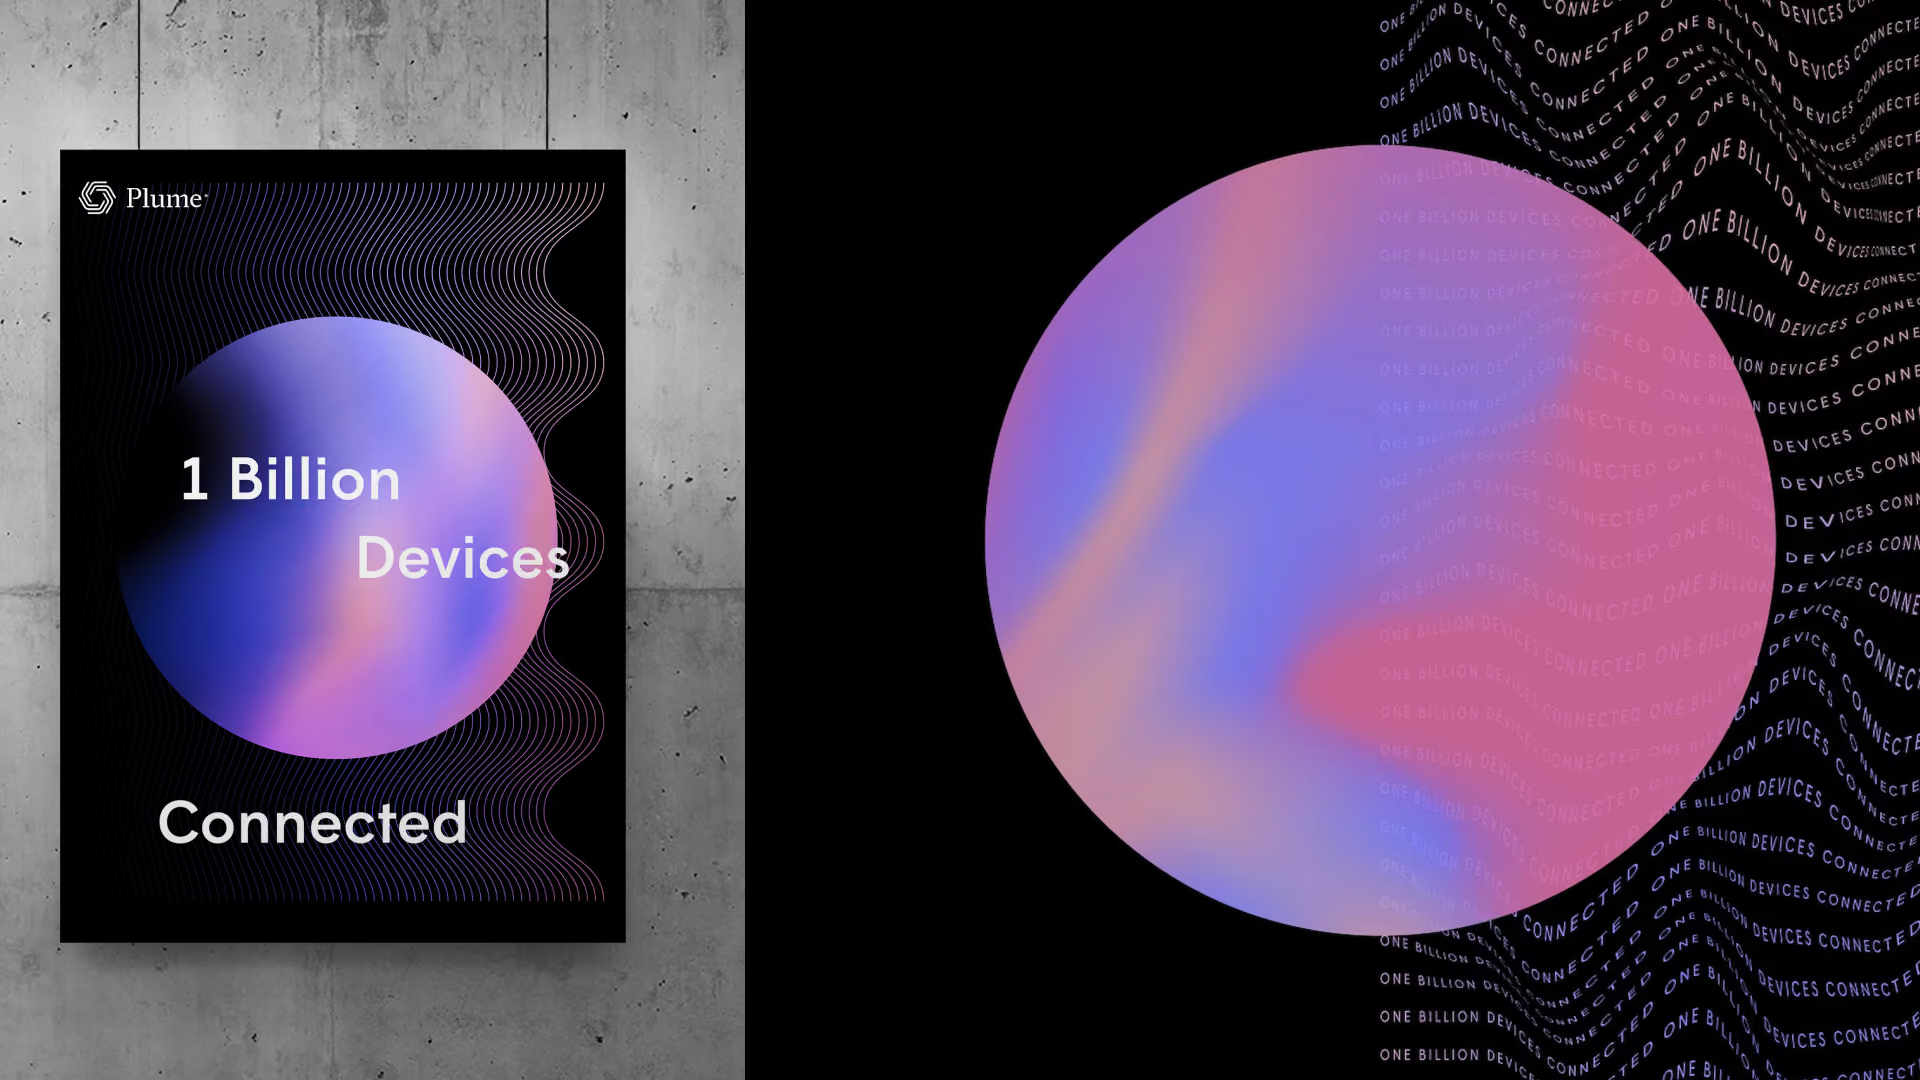
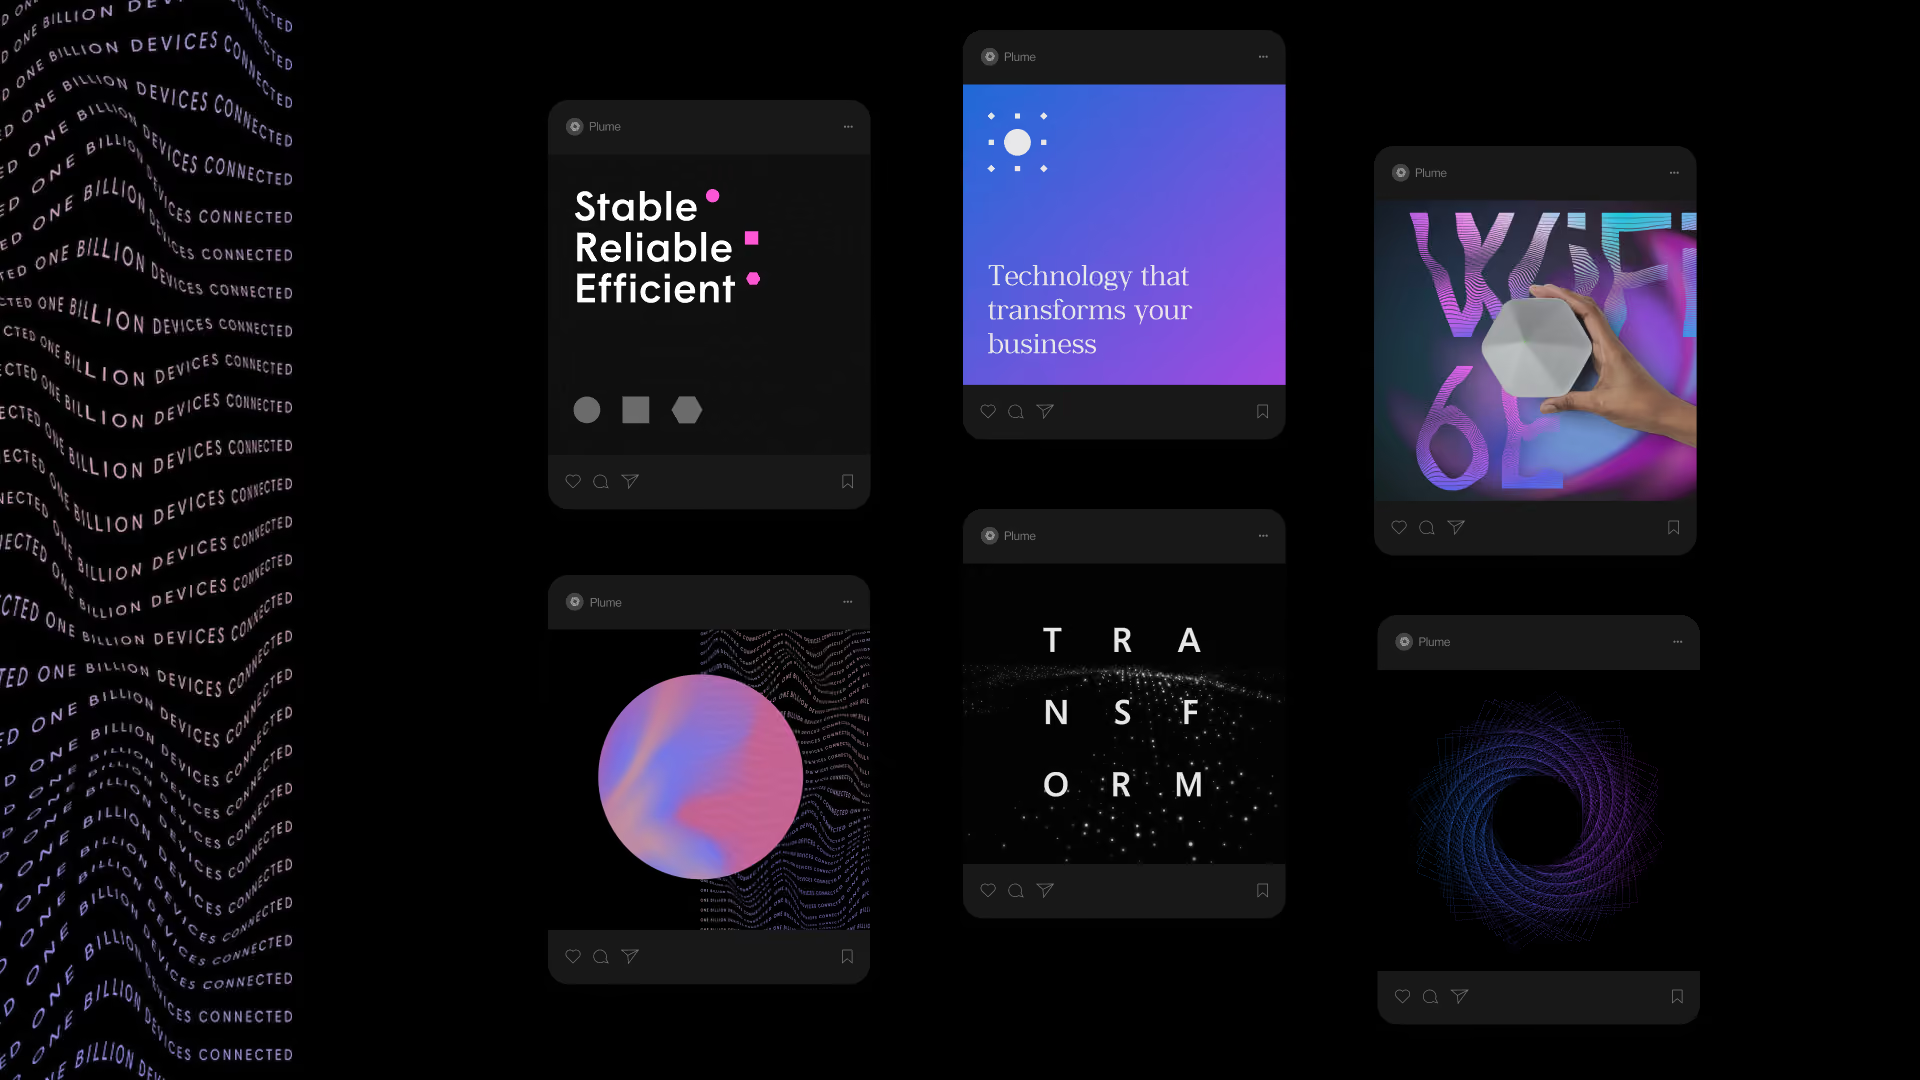
Plume's network carries 1.8 billion devices across 40 million homes in 195 territories. Data Stories is the system that made that telemetry public — a WebGL globe rendering live device density, a run of published reports, and the identity that came out of them. The data was not illustrated after the fact; the brand was drawn from what the network actually reported.


𝔊ET IN T𝔒UCH
TERMS OF USE
AMIT PATEL DESIGN𝔖®, CURIOU𝔖 𝔖PACE®, and MEDU𝔖A™ word marks and design marks, along with other names, logos, graphics, and materials displayed on the Site that function as trademarks (collectively, the "Marks"), are owned by or licensed to AMIT PATEL DESIGN𝔖® INℭ. These Marks are protected by copyright, trademark rights, and other intellectual property rights under United 𝔖tates and international law. Unauthorized use, reproduction, or distribution of these Marks is strictly prohibited.
Content on this site may not be used, reproduced, or otherwise exploited for purposes of training or developing artificial intelligence or machine learning technologies, nor for data mining, scraping, or crawling.